I run a single NVIDIA GH200. Ninety-six gigabytes of HBM3 bolted to a 72-core Grace CPU with 480 GB of LPDDR5X of its own, the two joined by a cache-coherent link roughly seven times fatter than the PCIe slot a normal GPU talks to its host through. Earlier this month I spent a night doing what you are supposed to do with a box like that: pick a model, isolate one variable at a time, measure, write it down.
I tested quantization. I tested speculative decoding. I got clean, repeatable numbers.
A few days later I upgraded the inference engine for a completely unrelated reason, re-ran the exact same configuration, and got 43 percent more decode throughput and a KV cache pool almost four times larger.
The variable I never tested moved more than everything I did.
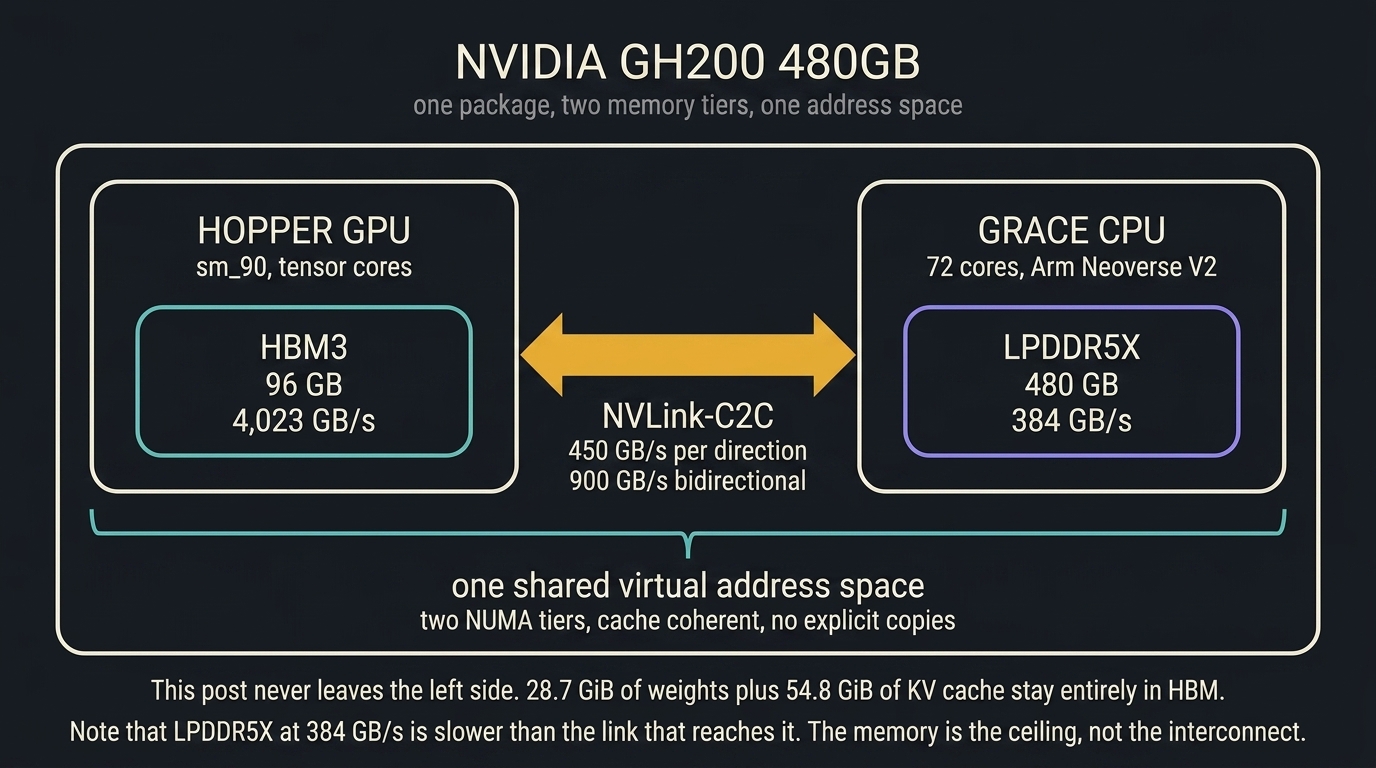
Before any of the numbers, the thing I actually want you to take away.
Open-weight architectures are moving quickly right now, and they are not moving toward more of the same. The model in this post is three-quarters linear attention. Others route a handful of experts out of hundreds on every token. Many now ship their own speculative draft heads inside the checkpoint. These are not parameter-count changes, they are structural ones, and every one of them has to be implemented in your serving engine before you can get anything like what the architecture is actually offering.
That makes the engine a lagging implementation of the model’s architecture. It is not neutral substrate. It is the other half of the thing you think you are running.
And the failure mode is not the clean one, where the model refuses to load and you go find a newer engine. It is the quiet one, where the model loads, serves correct output, passes your tests, and is modeled wrong underneath the whole time.
Reading the model card tells you what the architecture is. It does not tell you whether the thing you are running it on has caught up to that architecture yet. Those are two separate questions, and right now only one of them is easy to look up.
One model on one machine is a thin base for a claim that size, and I would rather say plainly that I am extrapolating from a pattern than pretend I proved a rule. What follows is one night of careful benchmarking, and what I found out by accident three days later.
What I actually tested
The model was Qwen3.8-27B, 27.3 billion parameters, dense, in its FP8 release. The engine was vLLM 0.19.1, which is what happened to be installed. Single stream, batch size one, because this box is a deep-thinking machine and not a serving fleet.
The first thing worth understanding is why single-stream decode is slow in a specific and predictable way.
Generating one token requires reading every weight in the model out of HBM. Not some of them. All of them. So decode is bandwidth bound, and you can compute the ceiling before you run anything at all. Against roughly 4 TB/s of HBM3 bandwidth, the 28.7 GiB of FP8 weights (30.8 GB, in the decimal units bandwidth is quoted in) gives you about 130 tokens per second at best. I measured 63.1. The gap is attention, kernel launch overhead, and sampling. The tensor cores, the part of the GPU everyone actually buys the card for, sit mostly idle.
That ceiling is also why speculative decoding works. Qwen ships an MTP head with this model, a small draft module that proposes the next two tokens which the full model then verifies in a single forward pass. One weight read can now yield up to three tokens instead of one. Turning it on took decode from 63.1 to 112.0 tok/s, a ratio implying roughly 1.78 accepted tokens per weight read.
A 1.78x speedup for one flag. That was the biggest lever I found that night, and I was pleased with it.
Before the next test, there is a second memory budget worth explaining, because most of what follows turns on it.
Alongside the weights, the server reserves a KV cache. As each token passes through, its keys and values are stored so that later tokens can attend back to it without recomputing the whole sequence every step. That cache grows with every token, and the per-token cost is fixed entirely by the architecture: two entries for K and V, times the number of key and value heads, times the head dimension, times the number of layers.
For this model that is 2 x 4 x 256 x 64, or 128 KiB per token. The model has 24 query heads, and not one of them appears in that formula.
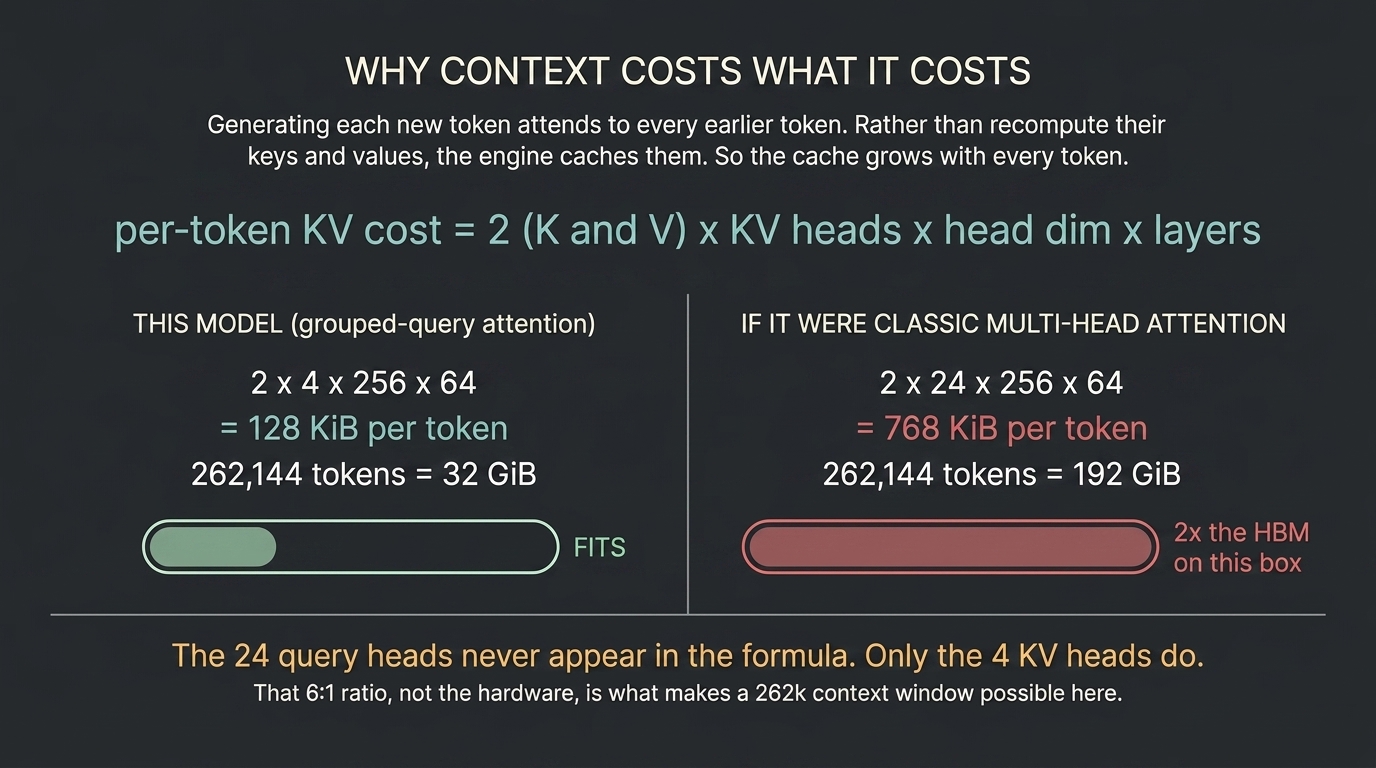
That is grouped-query attention, and on this box it is doing more work than the hardware is. Under classic multi-head attention, where every query head carries its own keys and values, that same 262,144-token window would want 192 GiB of KV cache. That is twice the HBM on this machine. The context window I am running is not a capability of the GPU. It is a decision somebody made about the architecture, and the GPU is merely large enough to benefit from it.
The second test was FP8 against BF16, and this is where the discipline paid off, because the result was not what the arithmetic predicted.
The same roofline says FP8 should decode about 1.8x faster than BF16, since it moves 30.8 GB per pass instead of 55.5 GB. With the speculative head active on both, the measured gap was four percent.
| Configuration | Weights | KV pool | Decode | Prefill @231k |
|---|---|---|---|---|
| FP8, no MTP | 28.7 GiB | 448,448 tok | 63.1 tok/s | 6,213 tok/s |
| FP8 + MTP | 28.7 GiB | 419,200 tok | 112.0 tok/s | 6,266 tok/s |
| BF16 + MTP | 51.7 GiB | 241,600 tok | 107.3 tok/s | 5,344 tok/s |
FP8 matmuls on Hopper still carry scaling and dequantization work, and the BF16 path is more mature for a recently released architecture. So the honest claim is not that FP8 is faster on this box. It is that FP8 is smaller, and on a machine where weights and KV cache compete for the same fixed pool of HBM, smaller is the thing that matters.
Look at the KV pool column. vLLM takes its memory budget, subtracts the weights, and hands whatever is left to the KV cache. BF16’s extra 23 GiB of weights come directly out of context. The pool falls to 241,600 tokens, which is below the model’s own advertised maximum of 262,144.
The server starts anyway. It does not warn you. You would find out on your first genuinely full-length request.
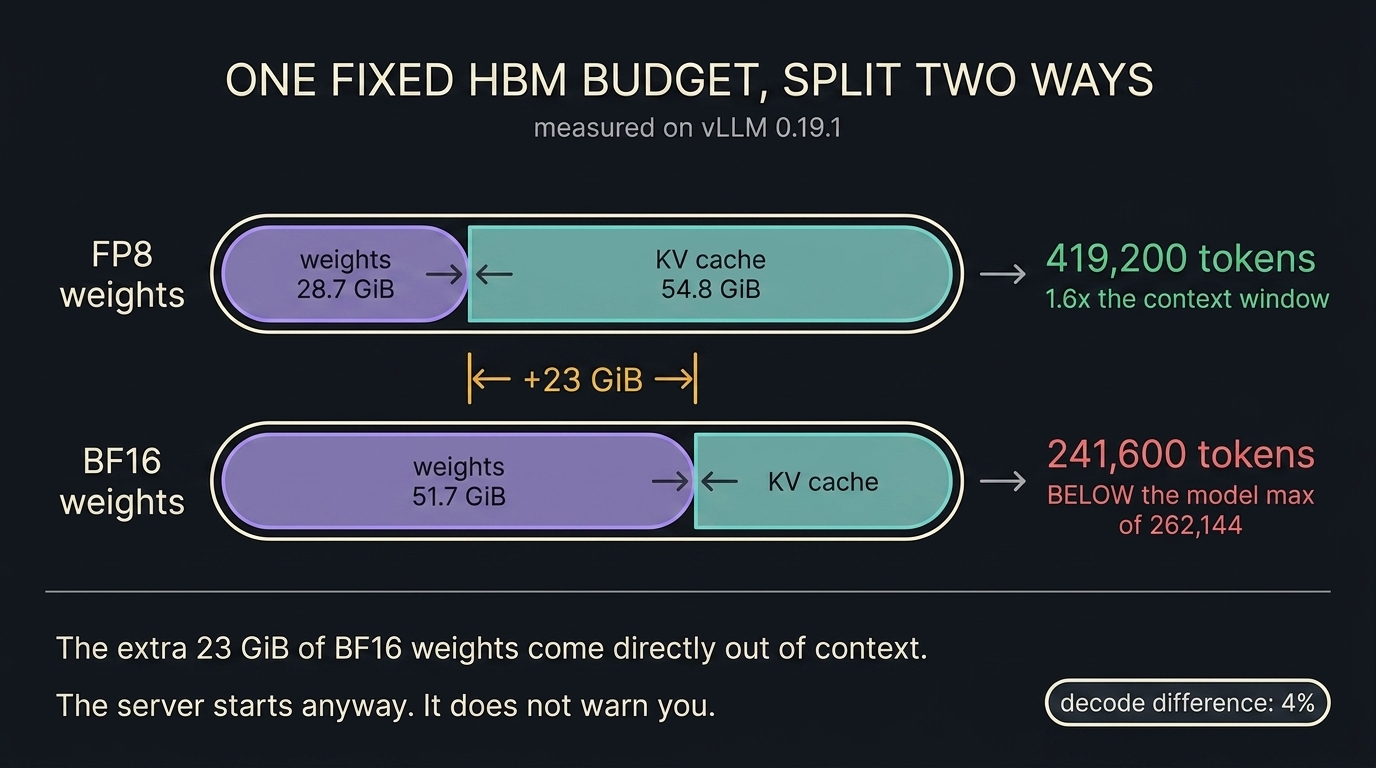
That is exactly the kind of latent failure careful A/B testing exists to catch, and I would have shipped the FP8 configuration with confidence.
The variable I did not test
A few days later I wanted to run DeepSeek V4-Flash, a 284B mixture-of-experts checkpoint whose architecture vLLM did not register at all until version 0.20.0. I went to 0.26.0 and installed it as a second environment alongside the original, so the working setup stayed untouched.
With the new engine sitting right there, I re-ran the Qwen benchmark on it. Same model, same quantization, same speculative config, same memory utilization, same hardware, same harness.
One thing I could not hold constant: the newer vLLM brought a newer torch and a newer CUDA toolkit with it. So “the engine” below means the serving stack, not a single version number. That is the honest scope of the comparison, and it happens to be the point.
| Metric | vLLM 0.19.1 | vLLM 0.26.0 | Delta |
|---|---|---|---|
| Decode @1024 | 112.0 tok/s | 160.0 tok/s | +43% |
| Decode @512 | 109.6 tok/s | 146.6 tok/s | +34% |
| Prefill @231k | 6,266 tok/s | 6,249 tok/s | unchanged |
| KV pool | 419,200 tok | 1,574,379 tok | 3.75x |
| Needle @231k | PASS | PASS | same |
The needle row is a retrieval check: bury a specific number about 231,000 tokens deep in the prompt and ask the model to read it back. Both engines returned it exactly, so at least that specific retrieval capability survived intact. One probe at one depth is not a quality evaluation, and I make no broader claim from it.
Two consecutive runs on the new engine returned 146.6 and 160.0, then 146.5 and 159.9. This is not measurement noise.
I had spent a night carefully moving one variable at a time inside a container I never thought to question.
The most important number in that table is the one that did not move.
Prefill was 6,266 tok/s before and 6,249 after. Unchanged. That is the tell, not a footnote.
Prefill and decode load the machine in opposite ways. Prefill processes the whole prompt in parallel, saturates the tensor cores, and is compute bound. Decode walks one token at a time and is bandwidth and overhead bound. The overhead-elimination work that dominates a lot of engine releases, scheduler changes and reduced host-side synchronization, has far more to offer decode than it does a phase already saturating the math units.
That is a tendency, not a law, and I do not want to overstate it. Compute bound does not mean untouchable. Engines ship real prefill wins, and better attention kernels and chunked-prefill scheduling have both moved it before. The narrower claim is the one I can actually defend: across this particular pair of versions, nothing that changed moved prefill at all.
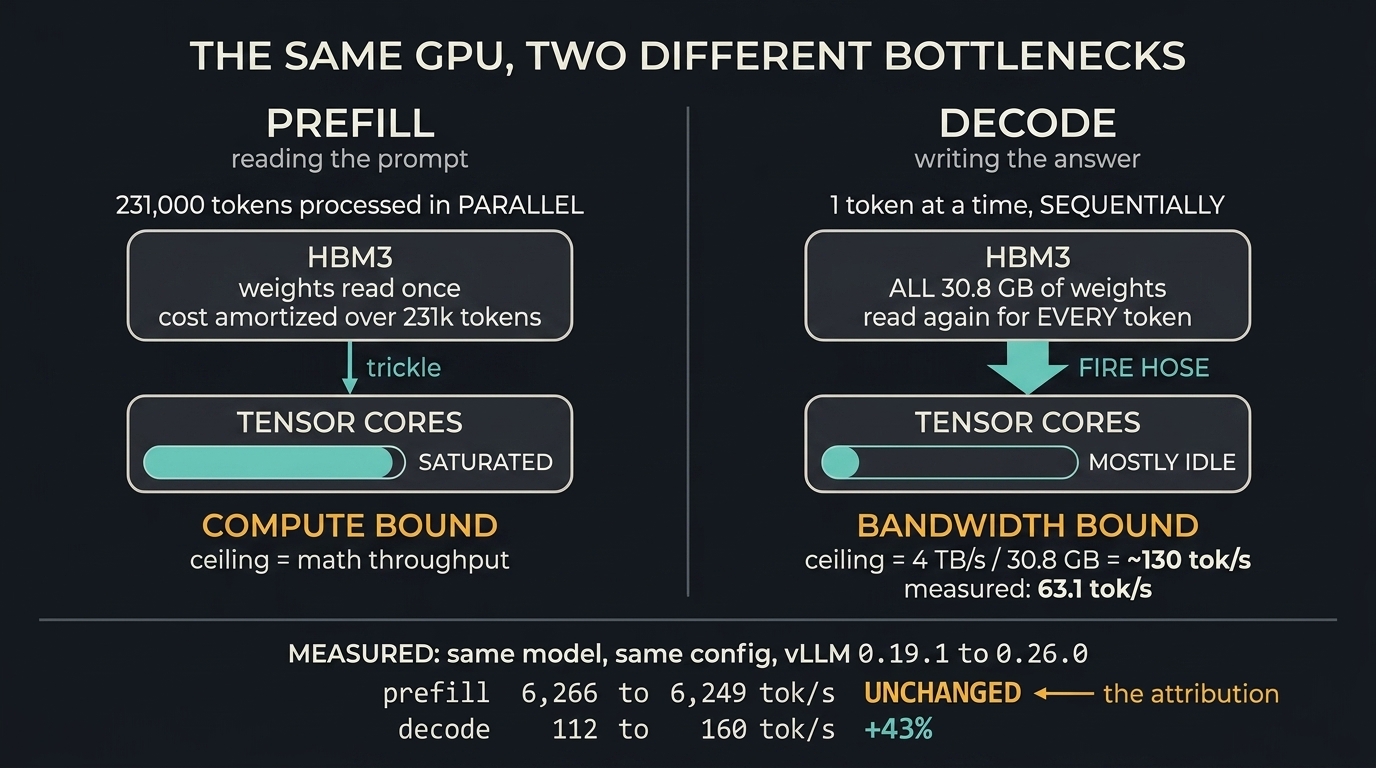
So the shape of the gain matches the shape of engine work exactly. Decode moved, prefill did not. If both had moved I would be hunting for a configuration mistake somewhere in my setup. Because only the bandwidth-bound half moved, I can attribute the gain to the engine rather than to drift.
A null result did the attribution work.
Why the KV pool nearly quadrupled
I did not know why when I first wrote this down. Chasing it turned out to sharpen the whole point.
Qwen3.8-27B is not a uniform stack of 64 transformer layers. Its config carries a field I had never once looked at:
"full_attention_interval": 4One layer in every four is full attention. The other three are Gated DeltaNet, a linear-attention mechanism that carries a fixed-size recurrent state instead of a KV cache that grows with the sequence. Of the 64 layers, only 16 ever need per-token KV. Forty-eight never do.
vLLM 0.19.1 did not know that. It treated all 64 layers as full attention and reserved growing per-token KV for every one of them, the overwhelming majority of it for layers that would never touch it. That half I can state flatly, because its reported pool matches the all-64-layers arithmetic exactly.
The other half I am inferring, and I should say so clearly. Hybrid KV allocation for this architecture family arrived in vLLM 0.21.0, listed in the release notes as “Model Runner V2: Qwen3.5/Mamba hybrid model support,” from a pull request merged in May, and it was hardened across several releases after that. Those release notes, plus a pool that grew by very nearly the layer ratio, strongly suggest that by 0.26.0 the engine reserves per-token KV only for the 16 layers that need it. I have not pulled vLLM’s per-layer cache-block counts and watched it happen. If I am wrong about the mechanism, that is where it would show, and I would rather you knew which parts of this I measured and which I concluded.
This is the quiet failure from the top of this post, in its concrete form. vLLM 0.19.1 ran this model perfectly well: correct answers, retrieval passing at 231,000 tokens, a working agent loop for weeks on end. It simply believed the model was something it was not, and reserved memory on that belief. Nothing errored, and nothing warned. I just had three quarters less context than I thought I did.
The layer ratio predicts the result. Sixty-four over sixteen is 4x. I measured 3.75x. The residual is consistent with the linear layers still holding a constant-size state that has to live somewhere, though I have not verified that to the byte.
Here is the part that stings.
I had hand-verified the KV arithmetic on 0.19.1. Two entries for K and V, four KV heads, 256 head dim, 64 layers, one byte per element gives 128 KiB per token. Divide 54.82 GiB by that and you get roughly 449,000 tokens. vLLM reported 448,448. It matched, so I moved on satisfied.
The arithmetic was correct. The premise was wrong. I had confirmed that the engine was doing exactly what it claimed to be doing, and quietly mistaken that for confirming it was doing the right thing. Those are different claims, and only one of them was worth my time.
It also retires the BF16 warning I made earlier. Apply the same correction there and BF16’s 241,600-token pool becomes roughly 900,000, comfortably clear of the 262,144-token window, and the latent failure I was so pleased to have caught simply is not there any more.
That is an inference from the layer ratio, not a measurement. I have not re-run BF16 on the newer engine, and by the standard I am arguing for in this post you should hold me to that distinction. But it sharpens the point rather than softening it. The finding was real. It was a finding about the engine, not about the format, and I filed it under the wrong heading.
Then I tuned it, one knob at a time
Having learned that the engine was the bigger lever, I went back and did the sweep properly on the new one.
Draft tokens first. I had been running two. The measured peak is four.
| Draft tokens | Decode @1024 | Decode @512 |
|---|---|---|
| 2 | 151.0 tok/s | 138.7 tok/s |
| 4 | 175.0 tok/s | 141.3 tok/s |
| 6 | 164.0 tok/s | 140.3 tok/s |
That curve has a shape and the shape has a reason. More draft tokens raise the theoretical ceiling, but acceptance decays with draft distance, so each additional proposed token is less likely to survive verification. Past the peak the engine spends more compute producing rejected drafts than it recovers. Six is past it. Every value was confirmed by a second identical run.
That peak is a property of this draft head on this engine. It is not a constant.
Prefix caching second. This one needed a purpose-built harness, because a standard decode benchmark sends a different prompt every call and therefore cannot see the effect at all. I sent one long prefix three times with a different trailing question each time and recorded time to first token.
| Caching off | Caching on | |
|---|---|---|
| Cold prefix | 2.78 s | 2.94 s |
| Repeat 1 | 2.76 s | 0.31 s |
| Repeat 2 | 2.76 s | 0.31 s |
| Speedup | 1.01x | 9.47x |
The 1.01x in the off column is the control. Without caching, a repeated prefix is re-prefilled in full, every single time.
But prefix caching is not free. Holding draft tokens at two, decode fell from 160.0 to 151.0 tok/s, about six percent, confirmed across three consecutive runs. That is real block-hashing overhead rather than noise.
Six percent of steady-state decode in exchange for an order of magnitude on repeat prefill is an easy trade for agent loops, where every turn resends the conversation and the file context. It is a bad trade for single-shot long-form generation, where nothing repeats. That is a workload question, not a performance question, and the right answer genuinely differs per user.
Here is the part I would have missed.
Stacking both knobs lands around 170 tok/s, not the 175 that four draft tokens produced on its own. Caching costs about six percent of decode. Going from two draft tokens to four gains about sixteen. They partially cancel.
Had I flipped both at once I would have recorded a healthy net gain and concluded that both knobs were pure profit. Testing one variable at a time is the only reason I know that caching is taxing decode at all.
And in the interest of not tidying up my own data: the adopted configuration measured 169.9 tok/s while the isolated four-draft-token run measured 175.0. Both runs were internally stable. I do not know where the difference comes from. It looks like launch-to-launch variance, and this work does not explain it.
What I would tell someone standing up their own box
The whole arc, with no hardware change at any point:
| Engine | Config | Decode @1024 | TTFT on a repeated prefix |
|---|---|---|---|
| vLLM 0.19.1 | spec=2, no caching | 112.0 tok/s | 2.76 s |
| vLLM 0.26.0 | spec=2, no caching | 160.0 tok/s | 2.76 s |
| vLLM 0.26.0 | spec=4 + caching | 169.9 tok/s | 0.31 s |
Fifty-two percent on decode plus an order of magnitude on repeated context. The single largest contributor to that arc was a version number I had written into my environment notes and then stopped thinking about.
I should be precise about what those numbers are not. Every figure in this post is throughput or a long-context retrieval check. I have run no quality evaluation of any kind. Nothing here claims that any of these configurations produces better output than any other, and I would not believe it if it did.
Four things I took from it.
Engine version belongs on the benchmark axis, not in the environment section. Any result I have is valid only for the engine that produced it. I now record it the way I record quantization, because it behaves like a variable and not like a footnote.
Re-test the tuning peaks whenever the model or the engine moves. Both have shifted this number by more than 40 percent on my hardware. A value that was optimal in one combination is a guess in the next.
One variable at a time, even when it feels slow. The knob interaction is invisible any other way, and the interaction was the finding.
Checking that a system does what it says is not the same as checking that it is right. My KV arithmetic agreed with vLLM’s reported number to within a rounding error. We were wrong together, in perfect agreement, for months.
The general form of the lesson is the part I keep returning to, because it is not really about inference.
Everything you hold fixed is a claim you are making. A control is an assertion that something does not matter, and you rarely go back and check it, because checking it is the same work as testing it and you already decided it was background. I decided the engine version was background. It turned out to be the experiment.
Somewhere in your stack there is a version number, a default, or an inherited flag you have stopped seeing. The background of your benchmark is someone else’s independent variable.